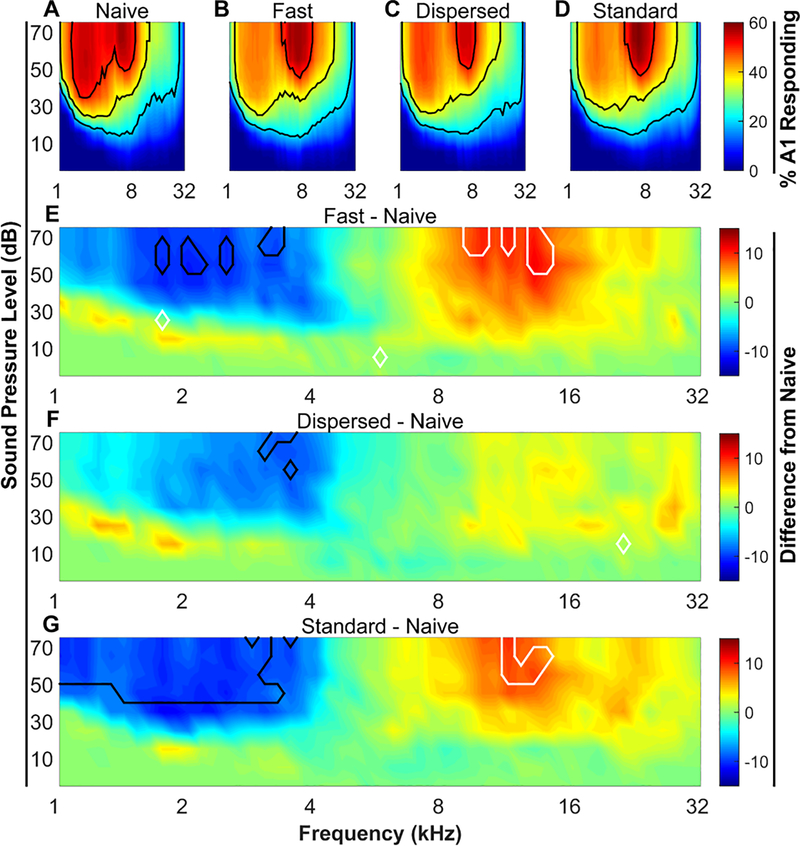
Figure 2. VNS-tone pairing reorganizes receptive fields in primary auditory cortex.
(A – D) Percent of area of A1 responding to each of the 1296 tones. Black contour lines denote 20%, 35%, and 50% of area responding. (E – G) Area responding difference plots. Naïve percent of area responding values were subtracted from each of the 3 VNS treated groups. Black and white contour lines denote areas of significant (P < 0.05) decreases and increases relative to naïve, respectively. N’s are 12, 11, 11, & 11 for naïve, Fast VNS, Dispersed VNS, and Standard VNS, respectively.

