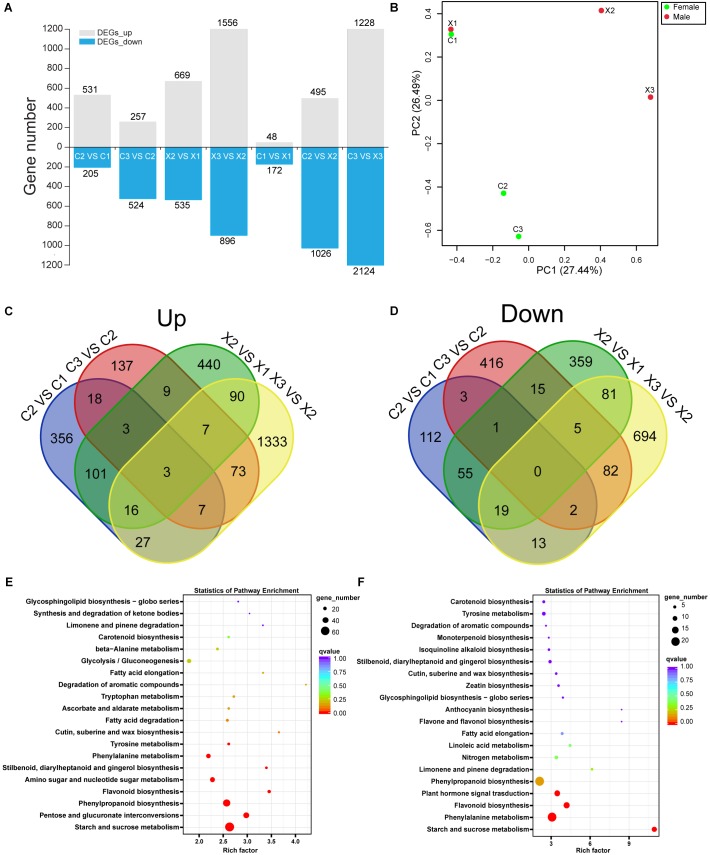
FIGURE 2.
Analysis of DEGs in male and female flowers. (A) Numbers of DEGs in male and female flowers. (B) PCA plot of DEGs in male and female flowers. (C,D) Venn diagrams of the up-regulated and down-regulated DEGs in male and female flowers. (E,F) KEGG enrichment of DEGs in male and female flowers.

