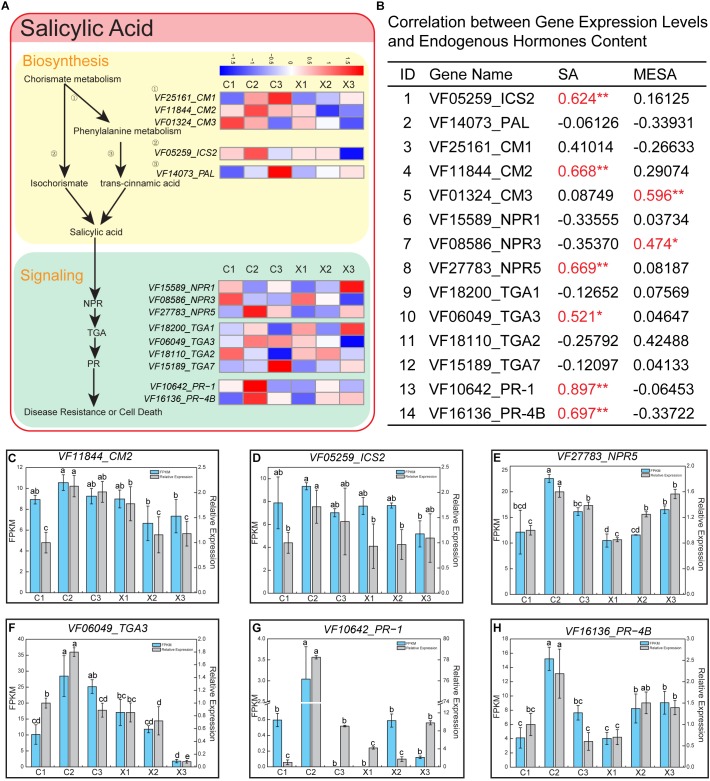
FIGURE 5.
Salicylic acid (SA) pathway in male and female flowers. (A) Representative gene expression profiles of SA biosynthesis and signaling pathway. The color intensity in the heatmap of each gene represents the relative expression levels of these genes at different stages of male and female flowers. (B) Correlation between gene expression levels and endogenous hormones content in male and female flowers. “∗” and “∗∗” after the correlation coefficients represent the correlation between their mRNA levels and endogenous hormone levels significantly different at p < 0.05 and p < 0.01, respectively. (C–H) Expression levels of CM2, ICS2, NPR5, TGA3, PR-1, and PR-4B based on FPKM and qRT-PCR data. Error bars indicate SD. Different letters represent significant difference in mRNA levels (p < 0.05).

