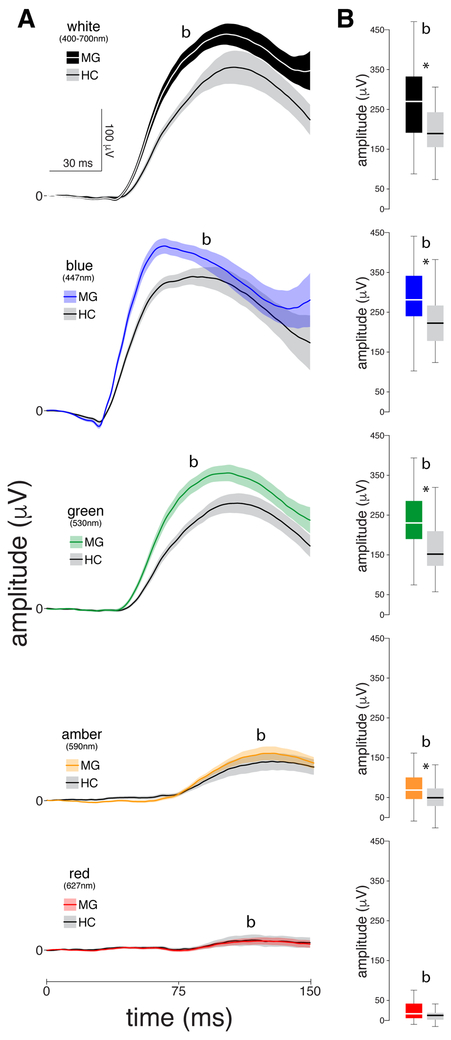
Figure 3.
Chromatic electroretinographies (ERGs) recorded interictally in 46 migraine patients and 42 healthy controls. (A) Standard dark-adapted rod ERG waveforms averaged (SEM) across patients and healthy controls. (B) Boxplots illustrating medians (thick horizontal white lines), interquartile ranges (25th–75th percentile; lower and upper box boundaries) and observations below and above the 25th and 75th percentiles (vertical lines) for b-waves for migraine patients and healthy controls. Significant differences between the two groups are depicted by asterisks.

