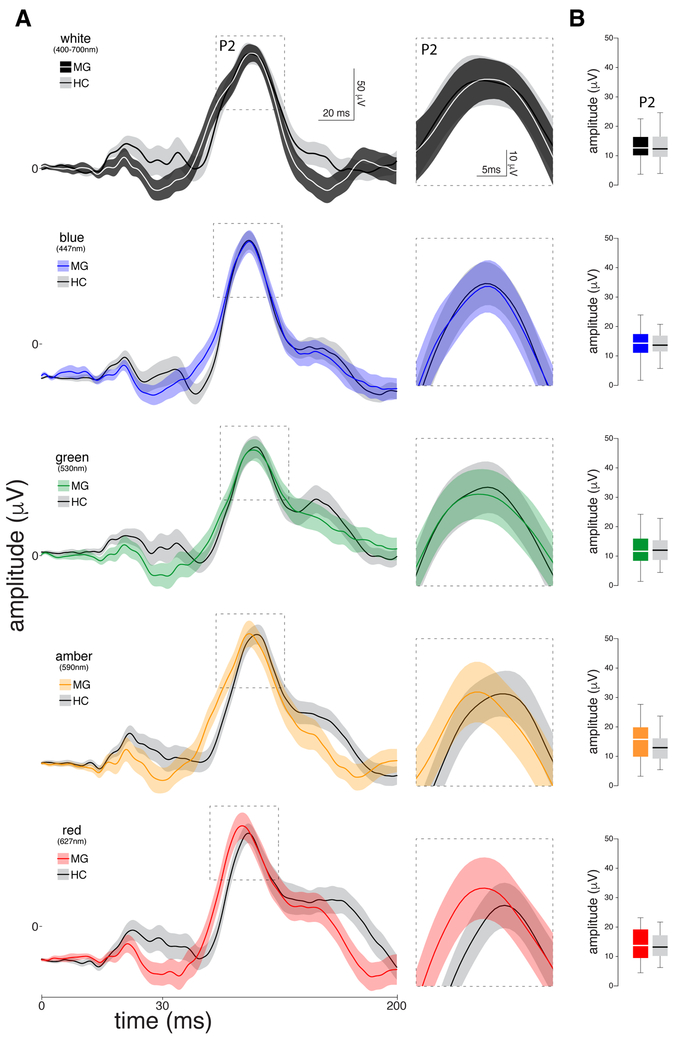
Figure 4.
Chromatic VEPs recorded interictally in 29 migraine patients and 31 healthy controls. (A) Left panel: Standard flash visual evoked potential waveforms averaged (SEM) in response to each color of light, focusing on the P2 complex. Right panel: Zoomed-in scale of the P2 component. (B) Boxplots illustrating medians (thick horizontal white lines), interquartile ranges (25th–75th percentile; lower and upper box boundaries) and observations below and above the 25th and 75th percentiles (vertical lines) for the P2 complex for migraine patients and healthy controls. Significant differences between the two groups are depicted by asterisks.

