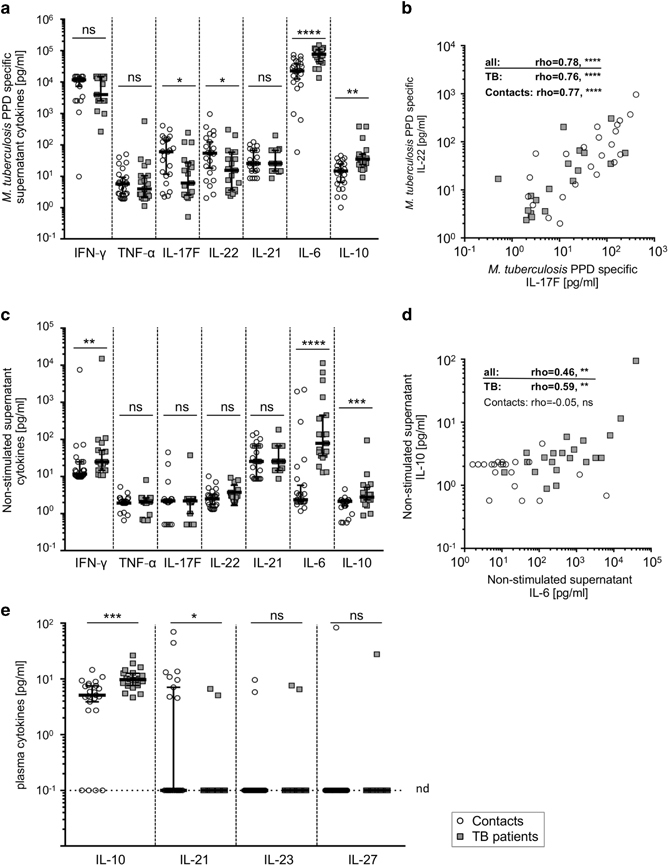
Figure 1.

M. tuberculosis PPD-specific and constitutive cytokine expression and plasma cytokine concentrations from tuberculosis patients and healthy contacts. Cytokine concentrations of IFN-γ, TNF-α, IL-17F, IL-22, IL-21, IL-6, and IL-10 of supernatants from diluted whole blood after 72 h in vitro culture with (a and b) or without (c and d) M. tuberculosis PPD are depicted. Association of differentially expressed cytokines are shown in (b) for PPD-specific IL-17F and IL-22, and (d) for constitutive IL-6 and IL-10 values. (e) Plasma concentrations of IL-10, IL-21, IL-23, IL-27 are shown for healthy contacts and tuberculosis patients. The dotted line indicates the detection limit for the respective cytokines. Symbols placed on this line indicate values below the detection limit. All samples were measured in duplicate, and mean values are indicated as open circles for healthy contacts and grey squares for tuberculosis patients. Study group medians and percentiles (25, 75) are shown. Significant differences are indicated by asterisks. Nominal P-values for the Mann-Whitney U-test (two-tailed) were calculated and shown as * for P<0.05, ** for P<0.01, *** for P<0.001, and **** for P<0.0001. The Spearman Rank test was used to determine significant correlations for all donors and both study groups separately. Correlation coefficients (rho) and nominal P-values are given. ns: not significant, nd: not detectable.
