
Figure 5.
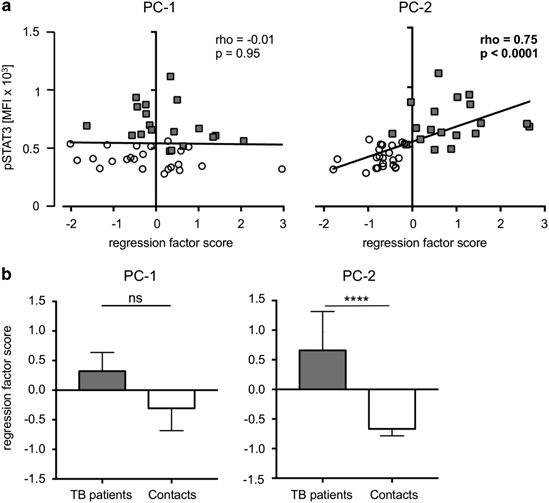
Multivariate analyses of influential factors and correlation with constitutive pSTAT3 in tuberculosis patients and healthy contacts. (a) Correlation of principal component (PC)-1 (left graph) and PC-2 (right graph) with constitutive pSTAT3 levels. The Spearman Rank test was used to determine significant correlations for all donors and both study groups separately. Correlation coefficients (rho) and nominal P-values are given. (b) Regression scores for PC-1 (left graph) and PC-2 (right graph) are compared between tuberculosis patients and healthy contacts. Data are presented as medians, and nominal P-values for the Mann-Whitney U-test (two-tailed) are shown.