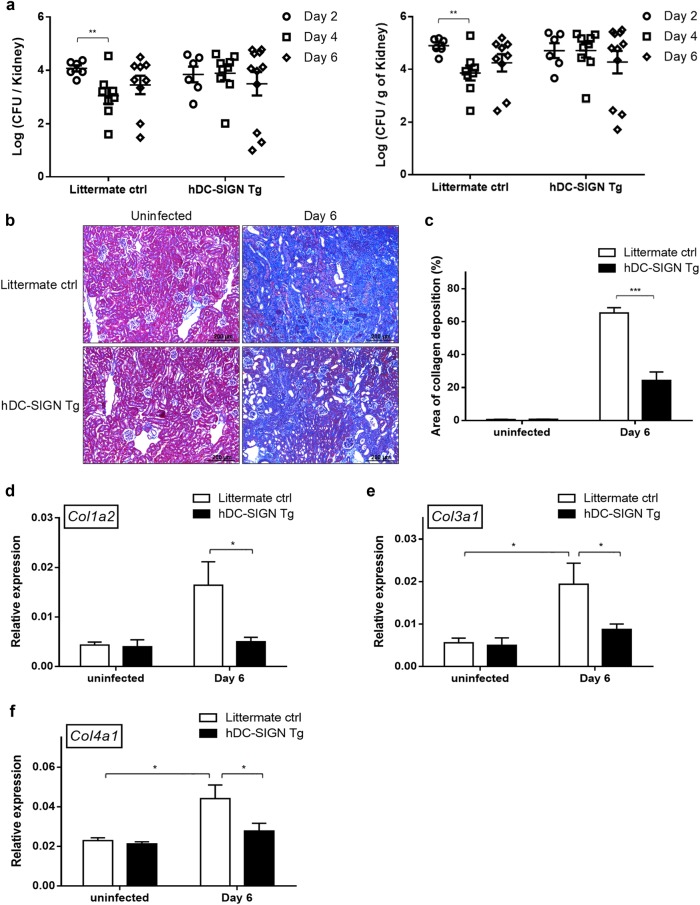
Fig. 2.
hDC-SIGN expression decreases C. albicans-induced collagen deposition. hDC-SIGN transgenic and littermate control mice were infected with 1 × 10⁵ of C. albicans intravenously. a Infected mice were perfused with PBS and kidneys were collected at the indicated time points after infection. Fungal burdens in the kidneys were determined. Day 2, littermate control and hDC-SIGN Tg, n = 6 each; day 4, n = 8 (littermate control) or 9 (hDC-SIGN Tg); day 6, n = 9 (littermate control) or 11 (hDC-SIGN Tg). Data were pooled from two or three independent experiments. b Paraffin-embedded kidney sections were stained with Masson’s trichrome stain to assess collagen deposition. Collagen fibers stained blue. Original magnification, ×100. Scale bar = 200 µm. c The area of collagen deposition was analyzed by the Tissue Studio software. Ten regions per section were analyzed. Percentage of the area of collagen deposition (%) was calculated as [collagen-positive area (blue)/(collagen-positive area + collagen-negative area)] × 100%. The mean percentages of the area of collagen deposition are shown. The bars represent the mean ± SEM. d–f The levels of type I (Col1a2), III (Col3a1), and IV (Col4a1) collagen were quantified by qPCR and normalized against Gapdh. Uninfected, n = 4; day 6, n = 8. Data were pooled from two to four independent experiments. The bars represent the mean ± SEM. Data were analyzed by two-way ANOVA followed by Tukey post hoc test. *p < 0.05, **p < 0.01, ***p < 0.001

