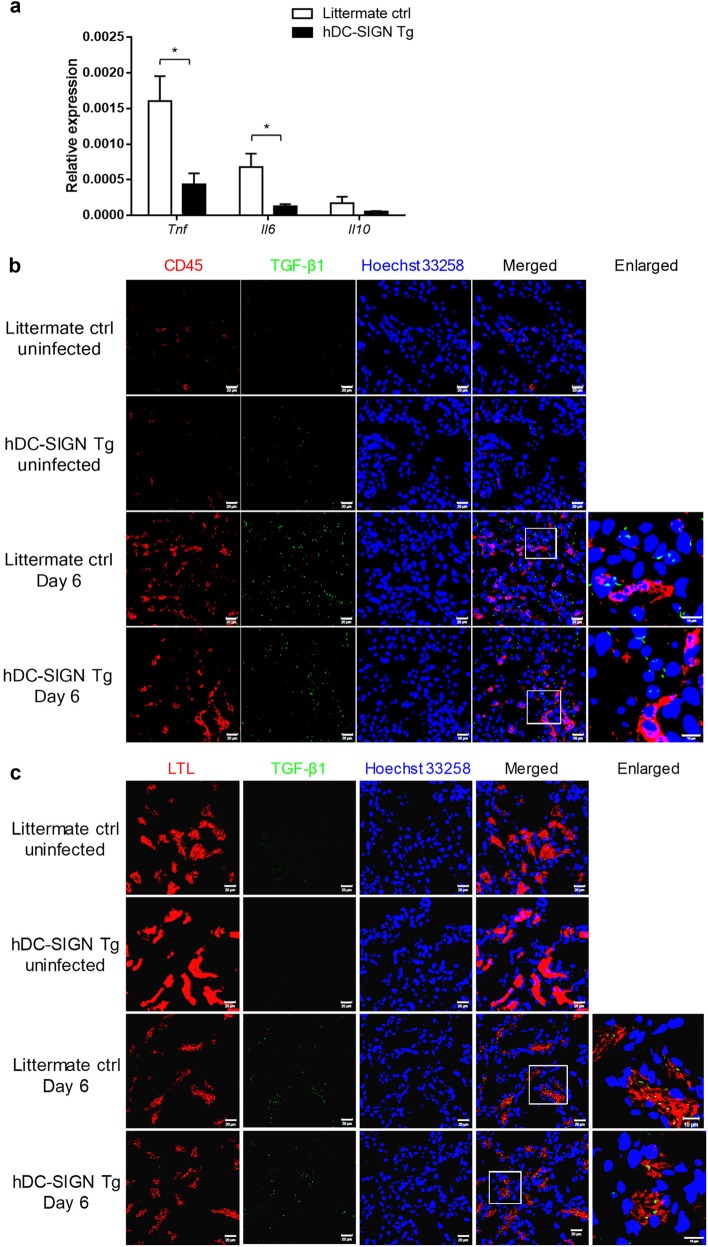
Fig. 5.
CD45+ and LTL+ cells as cytokine producers in the kidney. hDC-SIGN transgenic and littermate control mice were infected with 1 × 10⁵ of C. albicans intravenously. On day 6 after infection, mice were perfused with PBS and kidneys were collected. a Infiltrating cells (CD45+) were sorted from kidneys of infected mice. The levels of Tnf, Il6, and Il10 transcripts in the infiltrating cells were quantified by qPCR and normalized against Gapdh. n = 3/group. The bars represent the mean ± SEM. Data were analyzed by Student’s two-tailed t test. *p < 0.05. b, c Cryosections of kidneys were stained for b CD45 (red) and TGF-β1 (green) or c LTL (red) and TGF-β1 (green). Hoechst 33258 was used as a nuclear counterstain (blue). Boxed areas are shown at higher magnification (enlarged) next to the corresponding image. Slides were read under a confocal microscope. Original magnification, ×400. Scale bar = 20 µm (scale bar of enlarged graph = 10 µm)

