
FIGURE 3.
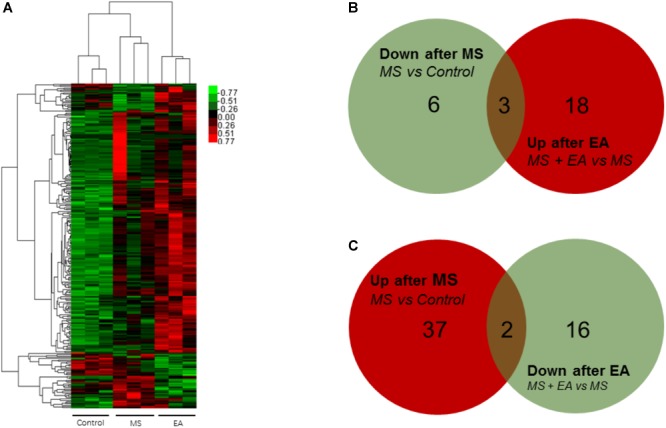
Differential mRNA expression in the prefrontal cortex of Cont, MS, and MS+EA in adult rats. (A) Heatmap of differentially expressed genes between Cont, MS, and MS+EA samples (p < 0.05) with green and red spectrum colors indicating downregulated and upregulated expression, respectively. (B,C) Venn diagrams show overlaps of differentially expressed genes between experimental groups. Three genes decreased in MS group but increased in EA group. Two genes increased expression in MS group but decreased in EA group.