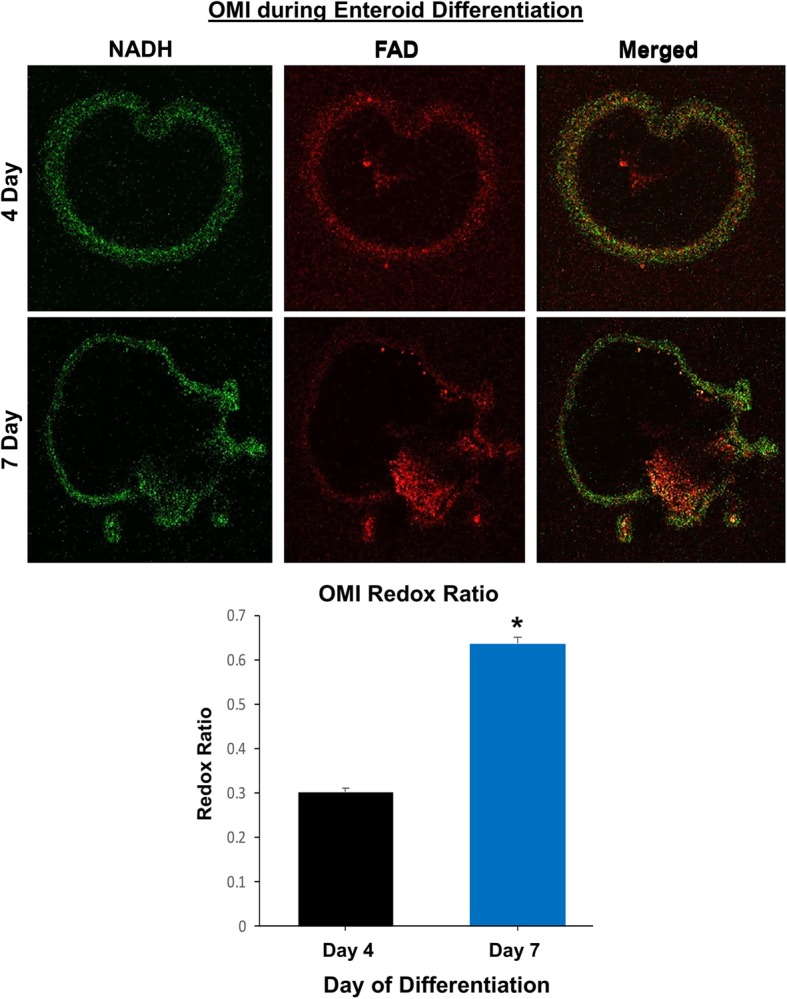
Fig. 7.

Optical metabolic imaging (OMI) reveals metabolic differences during differentiation of canine enteroids. Representative fluorescent images from 4- and 7-day-old enteroids are shown. The green image indicates the NADH measurement whereas the red image indicates the FAD, with the merged images on the right. The graph shows the optical redox ratio of 4-day-old versus 7-day-old enteroids (0.303 + 0.008 versus 0.637 + 0.013, respectively, for mean + SEM). n = 15 organoids per condition
