
Fig. 4.
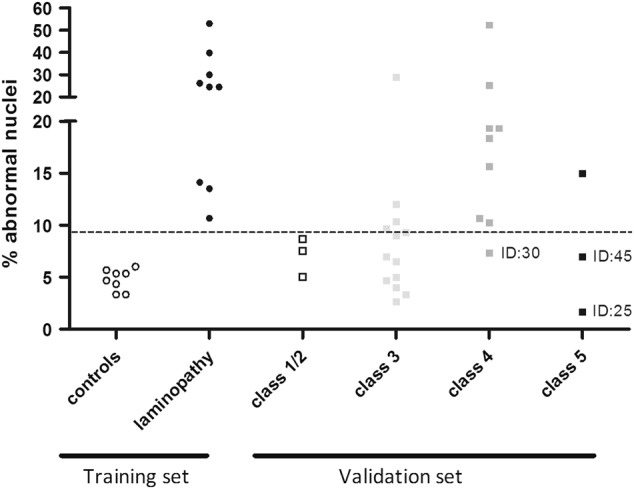
Distribution of the percentage abnormal nuclei identified per class LMNA variant. The percentage abnormal nuclei in controls (open circles) and laminopathy patients (black circles) were used as training set to generate the classifier. The percentage of nuclear abnormalities identified in the validation set are shown grouped based on their initial clinical genetic classification: class 1/2 ((likely) benign or recessive pathogenic variants in heterozygous state) in open squares; class 3 (VUS) light gray squares; class 4 (likely pathogenic) dark gray squares; class 5 (pathogenic) black squares. The three false negative variants are indicated by their ID number