Fig. 3.
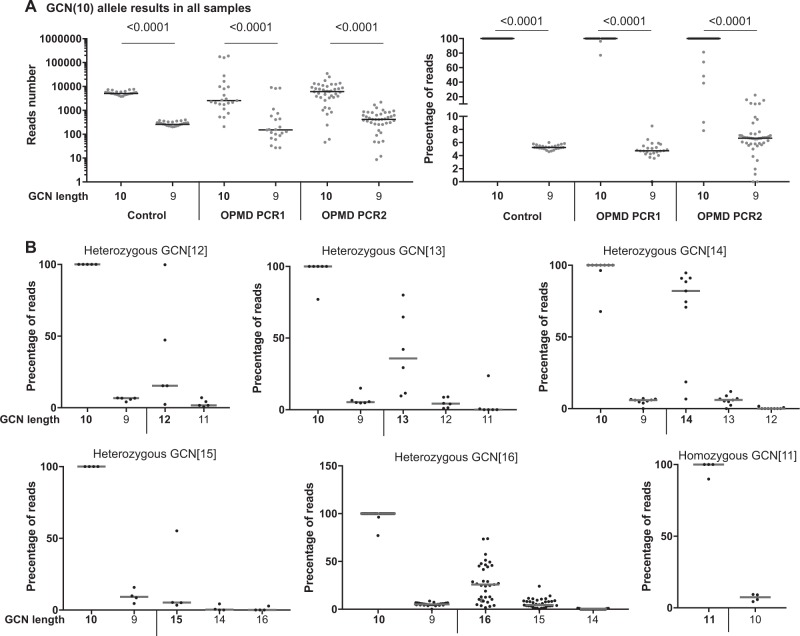
Stutters in trinucleotide GCN expansion. a Analysis of the wild-type allele (GCN[10]) in control and OPMD patients. The number of reads (left panel) or the percentage of reads with respect to the highest allele in the sample (right panel) are plotted against GCN length results. In the control group, results are from one PCR experiment. In the OPMD group, results are from two experiments: 20 amplification cycles (PCR1) or 40 amplification cycles (PCR2). The stutter percentage was significantly higher in the second experiment. Genuine allele length is depicted in bold and stutter allele length is in plain text. P-value was calculated by the Student’s T-test. b Analysis of sequencing results in OPMD subjects from two experiments. Plots show percentage of reads with respect to the highest allele in the sample for subjects with the same genotype (heterozygous: GCN[12], GCN[13], GCN[14], GCN[15], GCN[16], and homozygous GCN[11]). In each plot, the left side shows the wild-type GCN[10] and corresponding stutter GCN[9], the right side shows the expanded allele and its corresponding stutters. Genuine GCN length is depicted in bold and stutters are plain. Each dot represents an individual. Median is marked with a black line

