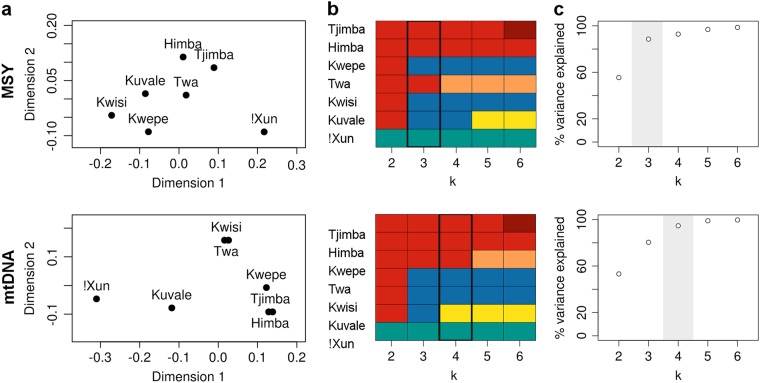
Fig. 3.
Multidimensional scaling (MDS) and k-means analysis based on Фst distances of mtDNA and the MSY. a MDS. The stress values are 0.003 and 0.006 for MSY and mtDNA, respectively. b k-means. Each color represents the cluster assigned to a population. c Percentage of variance explained by each k. The best k (i.e., the value where the percentage of the variance explained starts to plateau) is highlighted in gray

