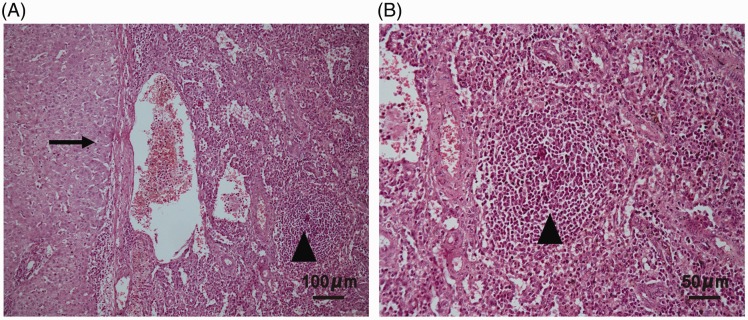
Figure 2.
Representative photomicrographs of a liver lesion tissue section stained with haematoxylin and eosin showing hepatic splenosis and normal liver tissue: (A) fibrous tissue isolates the liver and spleen parenchyma (arrow) with liver tissue on the left and spleen tissue on the right including lymphoid follicular tissue (triangle), original magnification × 100; and (B) lymphoid follicular tissue (triangle), original magnification × 200.

