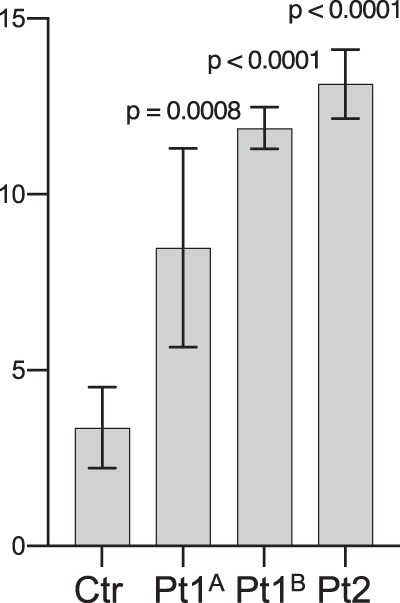
Fig. 4.

Apoptosis assay followed by flow cytometric quantification. Increased percentage of apoptotic cells (Q3 and Q2 fractions, reflecting early and late apoptosis, respectively) was found in two separate Norwegian (Pt1A and Pt1B) and a single Australian (Pt2) patient fibroblast cultures, and compared to three control fibroblast cultures (Ctr bar show merged results) after a similar number of passages. The values above the error bars represent p-values from an unpaired t-test
