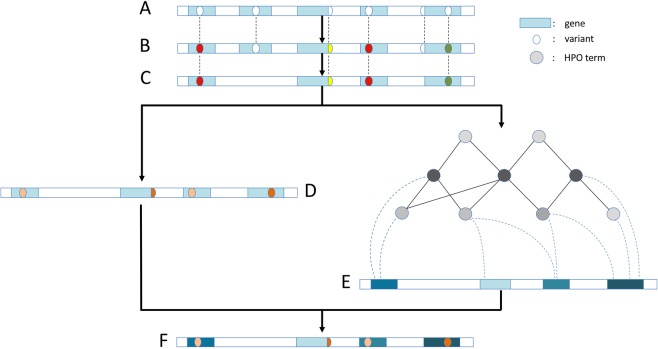
Fig. 1.
Step-wise schema of Phenoxome’s overall workflow. a Raw variants yielded from sequencing the patient’s exome and subsequent bioinformatics analysis. Blue rectangles imply genes and ovals indicate variants. b Variants annotated by Phenoxome using a series of bioinformatics resources. Distinct color schemes indicate different predicted effects on protein products. c Variants retained after filtering procedure depending on HGMD annotations, population allele frequency and functional effects. d Variants deleterious score are derived from the tier strategy where a darker color implies a more disruptive variant. e Genes harboring post-filtered variants are assigned phenotypic relevance scores inferred by their associations with relevant phenotypes in HPO. A darker color implies the gene is more pertinent to the patient’s phenotypic manifestation. f Each of post-filtration variants receives an overall score by integrating both variant deleterious score and the gene’s phenotypic relevance score. Hence a global prioritization of the variants is achieved in the framework

