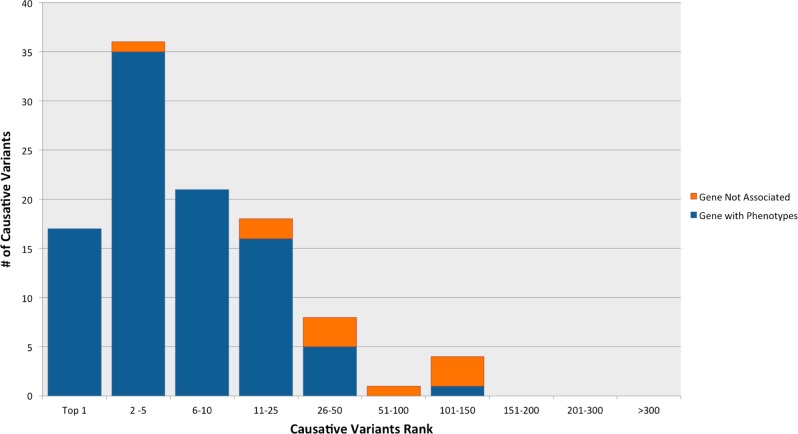
Fig. 4.
Summary of performance of phenoxome on clinical cohort. Blue bars represent the cases where the causative variants/genes are associated with at least one pertinent phenotype. Orange bars represent the cases where the causative variants/genes are not associated with any pertinent phenotype. 53(51%) target variants were ranked in top 5 while 92(88%) target variants were ranked in top 25 among 105 clinical cases

