Figure 1.
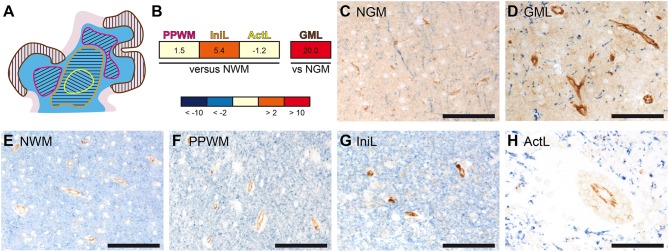
Gene and protein expression of PECAM-1 is pronounced in initial white matter MS lesions and active cortical MS lesions. (A) Representative schematic overview of the different MS lesions included in the microarray analyses. The separately microdissected zones are encircled by differently colored lines: yellow, active demyelinating lesion; orange, initial (pre-phagocytic) lesion; pink, periplaque white matter; brown, active cortical gray matter lesion. White matter is depicted in blue; the cortical ribbon is depicted in rose. (B) Gene expression analysis in microdissected MS brain lesions. PECAM-1 expression in affected white matter areas (n = 4 patients) was compared to normal white matter of healthy controls (n = 4 subjects); PECAM-1 expression in active cortical gray matter MS lesions (n = 3 patients) was compared to cortical areas isolated from healthy controls (n = 3 subjects). Non-parametric analyses did not reach any significance levels (white matter: H(3) = 1.888, p = 0.6284; gray matter: U = 0.000, z = −1.964, p = 0.100, r = −0.802). PPWM, periplaque white matter; IniL, initial (pre-phagocytic) lesions; ActL, active demyelinating lesions; NWM, normal white matter; GML: gray matter lesion; NGM: normal gray matter (C–H) Immunohistochemical double-labeling for PECAM-1 (brown) and the myelin component proteolipid protein (PLP; blue) of normal gray matter of control (C), active cortical gray matter MS lesion (D), normal white matter of control (E), periplaque white matter (F), initial (pre-active) MS lesions (G) and active MS lesions (H). Representative pictures are shown. Scale bars, 100 μm.

