Figure 4.
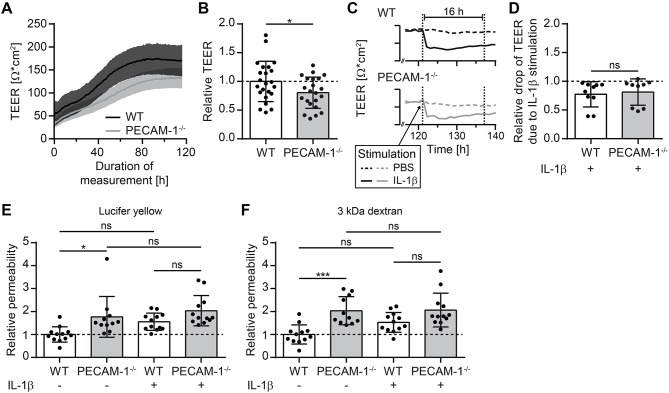
PECAM-1−/− pMBMECs exhibit impaired barrier properties. (A) Transendothelial electrical resistance (TEER) of pMBMECs grown on filter inserts was measured by impedance spectroscopy using the cellZscope® (nanoAnalytics) starting 2 days after cell isolation over a period of 5 days in hourly intervals. Solid lines (black, WT; gray, PECAM-1−/−) represent mean values and shaded areas represent SEM calculated from 6 filter inserts with WT pMBMECs and 5 filter inserts with PECAM-1−/− pMBMECs, respectively. One representative experiment out of three is shown. (B) Relative TEER of WT and PECAM-1−/− pMBMECs was calculated from maximal TEER of each filter insert with WT set to 1.0. Graph combines three independent experiments (WT, 23 filter inserts; PECAM-1−/−, 22 filter inserts). Dots represent individual data points; error bar ± SD. Reported statistics result from unpaired, two-tailed Student's t-test. Test statistics: p = 0.042, t(43) = 2.096, d = 0.639. (C) Exemplary TEER curves for PBS- and IL-1β-treated WT and PECAM-1−/− pMBMEC monolayers are shown. Dashed lines, PBS-treated filter inserts; solid lines, IL-1β-treated filter inserts; dotted vertical lines, 16 h time window of stimulation. (D) Relative drop of TEER indicating the decrease of electrical resistance 16 h after stimulation (final concentration of 20 ng/ml IL-1β per insert) normalized to genotype-matched PBS-treated filter inserts. Dots represent individual data points; error bar ± SD. Reported statistics result from unpaired, two-tailed Student's t-test. Test statistics: p = 0.714, t(17) = 0.373, d = 0.181. (E,F) Relative permeability coefficient of the two different sized fluorescent tracers Lucifer yellow (457 Da) (E) and Alexa-Fluor-680-conjugated 3 kDa dextran (F) across WT and PECAM-1−/− pMBMEC monolayers normalized to the mean WT value. Data are derived from four independent experiments (WT, 12 filter inserts; PECAM-1−/−, 11 to 12 filter inserts). Dots represent individual data points; error bar ± SD. Reported statistics result from one-way ANOVAs with Sidak's multiple comparisons test. Test statistics: (E) F(3, 43) = 6.382, p = 0.0011, η2 = 0.308; (F) F(3, 43) = 9.375, p < 0.0001, η2 = 0.395; *p < 0.05; ***p < 0.001; ns, not significant.

