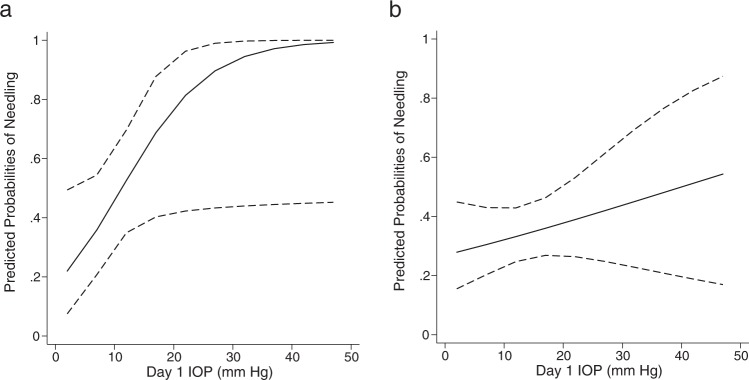
Fig. 1.
a Graph showing the association of probability of needling (with 95% confidence intervals in dashed lines) with postoperative IOP on day 1 in XEN alone group. b Graph showing the association of probability of needling (with 95% confidence intervals in dashed lines) with postoperative IOP on day 1 in XEN + cataract group

