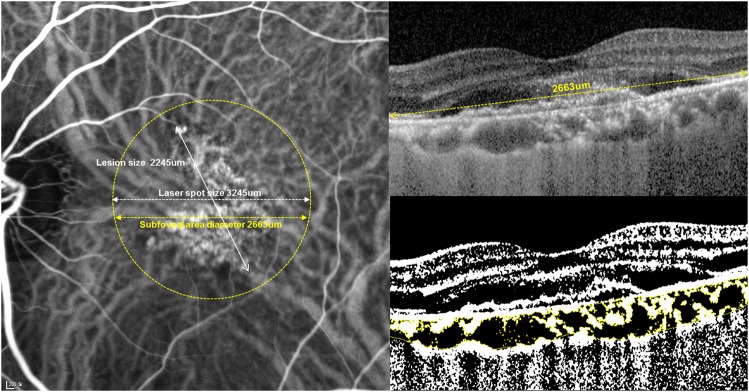
Fig. 1.
Measurement of choroidal vascular density (Left) Indocyanine green angiography image is marked with photodynamic therapy (PDT) laser spot (yellow dot circle). (Right) Enhanced depth imaging OCT image (Top) and converted binary image (Bottom) of the subfoveal area in the circle of PDT laser spot. An EDI-OCT image of was converted to a binary image using the ImageJ software. The dark areas (luminal) of choroid were traced by the Niblack method. After adding the data of the distance of each pixel, the choroidal area, luminal area, and interstitial area were automatically calculated. The dark pixels were defined as the luminal area. The stromal area was calculated by subtracting luminal area from the total choroidal area

