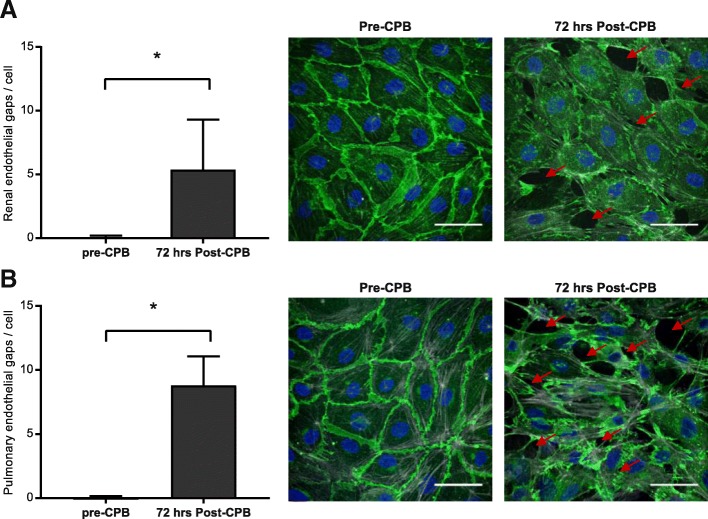
Fig. 2.
Post-CPB plasma induces renal and pulmonary endothelial gap formation. Quantification of renal (a) and pulmonary (b) intercellular gap formation and representative images of endothelial cells after exposure of plasma from patients before CPB (pre-CPB, middle panels) and 72 h after CPB (72 h post-CPB, right panels). Endothelial cells were stained for VE-cadherin (adherens junctions; green), actin (stress fibers; white), and DAPI (nuclei; blue) after 3 h of plasma exposure. Red arrows indicate examples of endothelial gaps. Scale bar represents 50 μm. Data represent mean number of gaps per endothelial cell ± SD quantified from n = 5 images per time point from 6 patients. One-way ANOVA with Bonferroni post-hoc analysis, *P < 0.05 versus pre-CPB. CPB, cardiopulmonary bypass; SD, standard deviation

