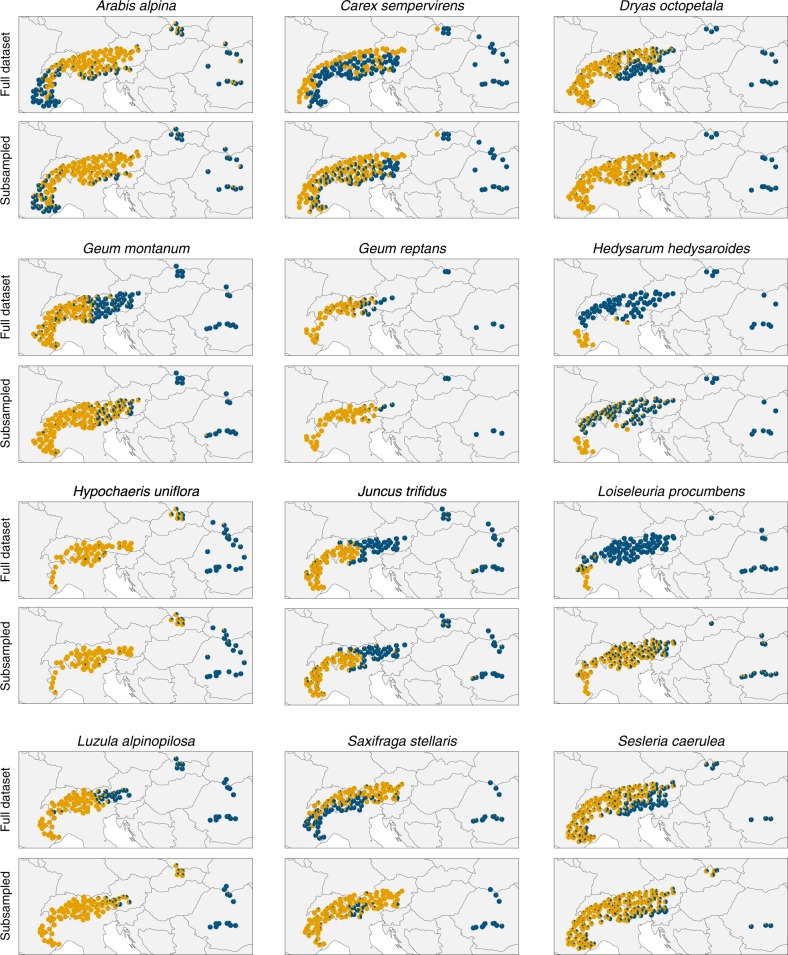
Fig. 2.
Maps showing the results of Structure analyses of AFLP data for 12 alpine species, for both the full unbalanced data sets and subsampled balanced data sets. Pies represent the assignments (q-values) to K = 2 clusters, averaged over the three individuals that were sampled at each location. The maps for the subsampled data sets were calculated by averaging the assignments over 500 replicate analyses per species

