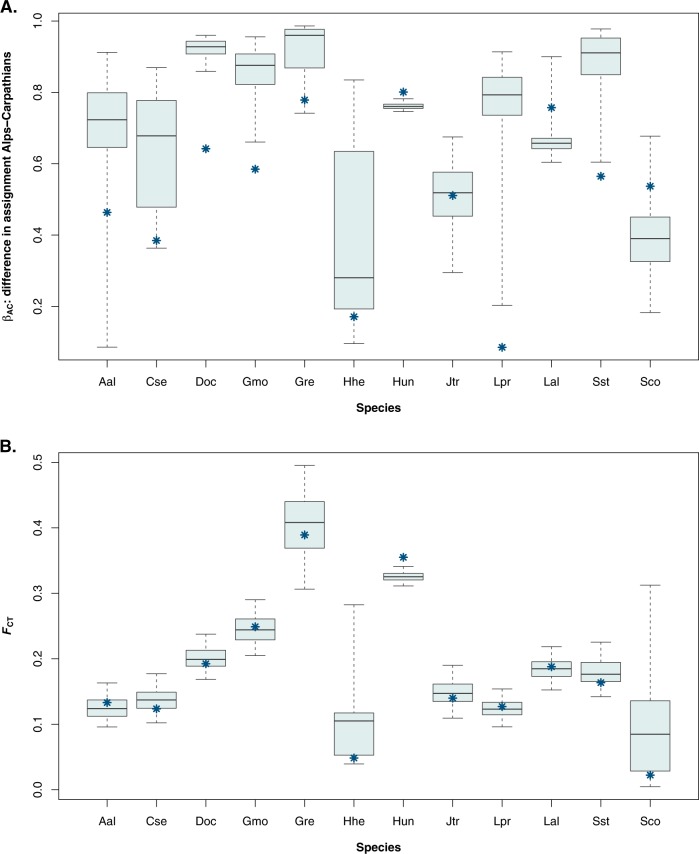
Fig. 3.
Divergence between populations from the Alps and from the Carpathians for 12 alpine species based on the results of Structure (a; βAC statistic) and the results of an AMOVA (b; FCT). Asterisks represent the results of the full data set with unbalanced sampling; boxplots represent the distribution of the results of the 500 replicate subsamples where sample sizes from the Alps matched those from the Carpathians (thick line gives the median; box gives 25% and 75% percentiles; whiskers give 2.5% and 97.5% percentiles)

