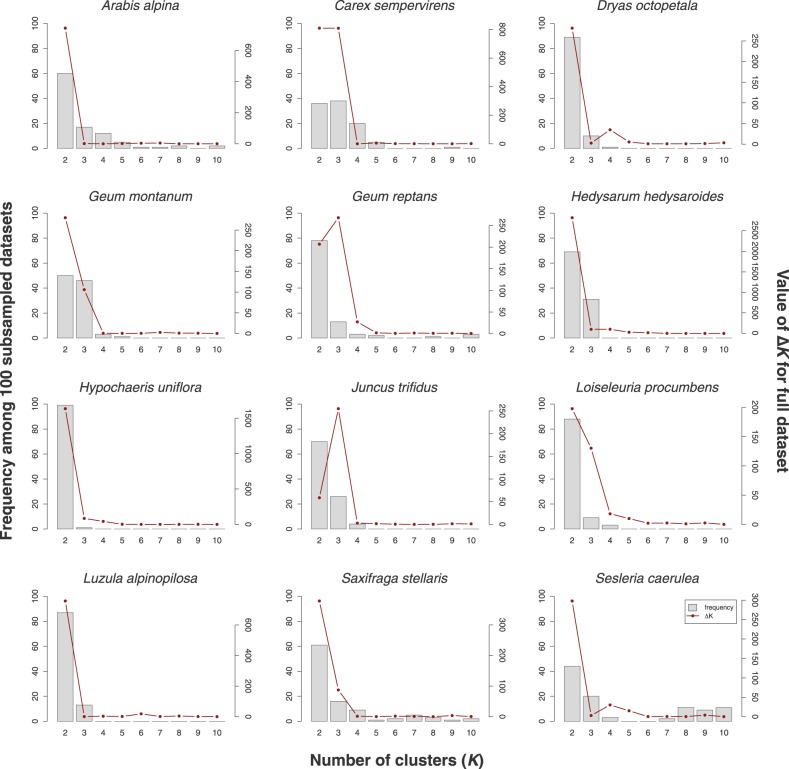
Fig. 5.
Inference of the optimal number of clusters according to the ΔK-statistic (Evanno et al. 2005). For each of the 12 species, the red line shows the value of ΔK for the full data set (secondary Y-axis); the histograms show the frequency at which each value of K was inferred to be the optimal value among 100 of the 500 subsampled data sets (primary Y-axis)

