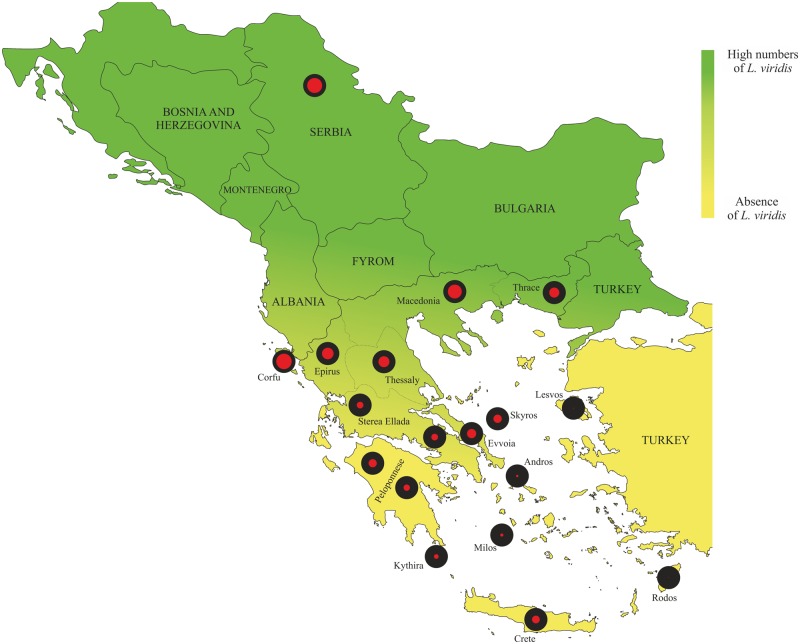
Fig. 1.
Sampling localities for Lacerta viridis and Lacerta trilineata. Black filled circles indicate the total number of MHC class I alleles found in each population of L. trilineata (i.e. 100%). Red filled circles denote the percent of shared alleles between L. trilineata and L. viridis. MHC allele similarity between species is differentiated along a north–south gradient, with northern populations of the two species sharing more MHC alleles compared to southern and insular ones, where L. viridis is present in low numbers or even absent

