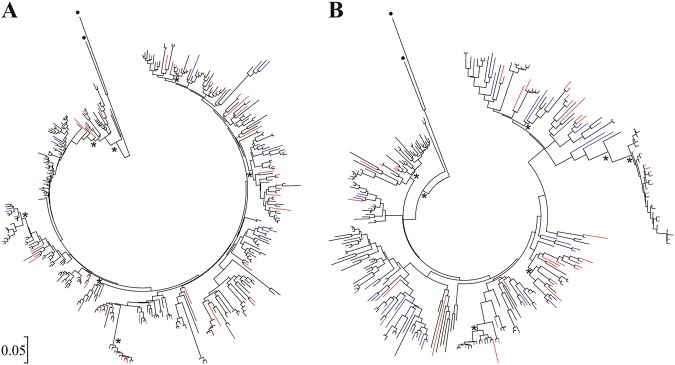
Fig. 3.
Bayesian inference trees illustrating the phylogenetic relationships of a exon 2 variants and b exon 3 variants using all sites. Asterisks indicate posterior probabilities higher than 0.75. Black dots denote outgroup sequences. Black lines indicate alleles that were only found in Lacerta trilineata, blue lines for L. viridis, whilst red lines identical alleles that are shared among species

