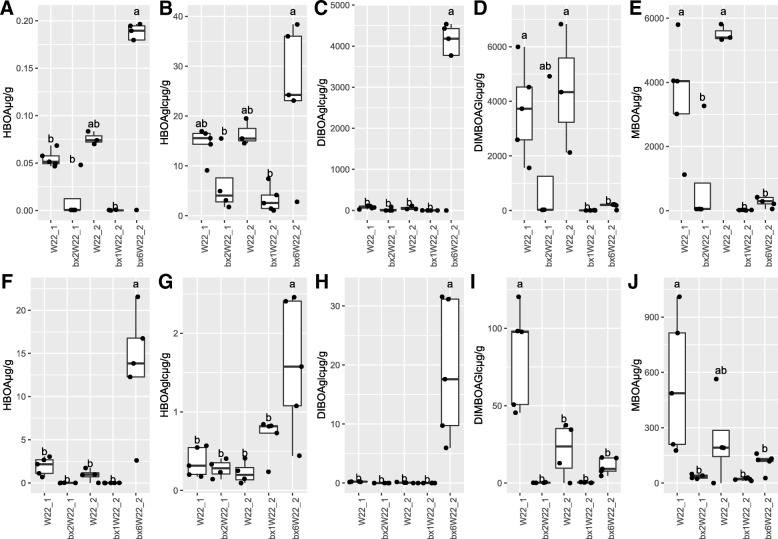
Fig. 1.
Quantities of BXs detected in the maize tissues of parental lines and mutants. The content of BXs in shoot tissues are shown in the upper row (A, B, C, D, E) and in root tissues in the lower row (F, G, H, I, J). Multiple comparison of treatments was carried out using HSD test and lowercase letters represent significant difference between genotypes

