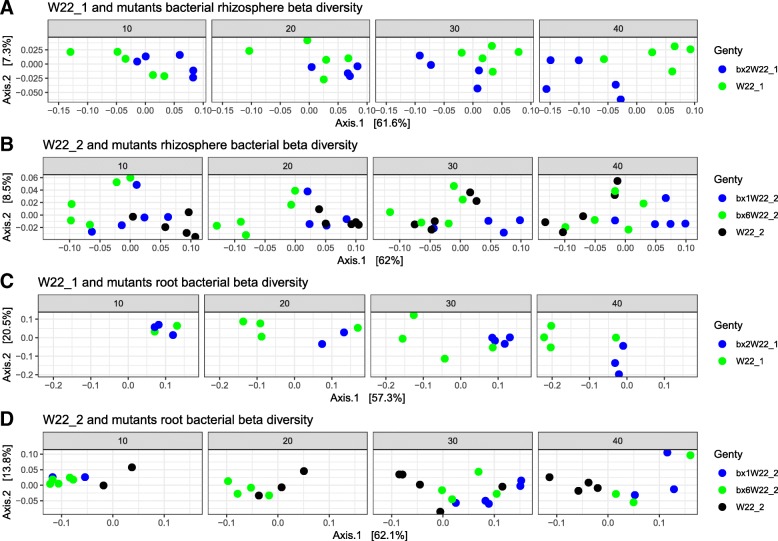
Fig. 4.
PCoA of bacterial communities using weighted UniFrac for the maize rhizosphere and roots. Parental lines and their corresponding mutants are shown separately in the rhizosphere (a, b) and roots (c, d). Samples are colored for each genotype. W22_1 and its mutants (a, c) and W22_2 and their mutants (b, d) are shown for each DAS

