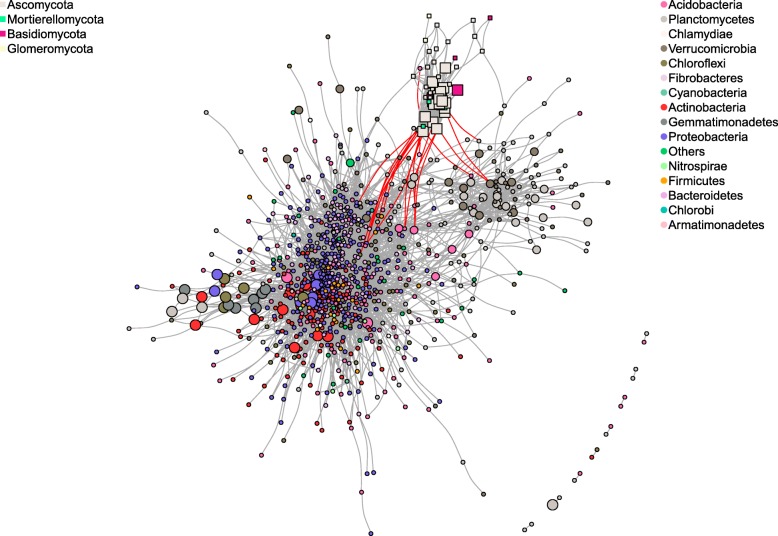
Fig. 7.
Microbial network based on Spearman’s correlations in the roots of W22_1 and its mutant. OTUs are shown as nodes, and correlations as edges. Positive and negative correlations are shown with grey and red edges, respectively. Bacterial and fungal nodes are represented as square and circle symbols in the network, respectively. Indicator OTUs for bx1W22_1 and W22_1 are shown with a large and a medium node size while others are shown with small size to indicate the location of indicator species in overall network

