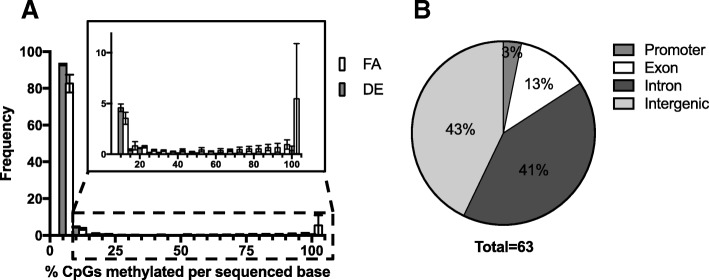
Fig. 3.
a Histogram of % sequences methylated within sequenced CpGs. Individual CpGs were analyzed and placed into 5% incremental bins displaying the % of CpGs from all reads methylated for a given bin. The count of CpG sites from all sequences of a given sample that show methylation in 0–5% of a samples reads are put in the 0–5% bin, and so on. The counts for each bin are averaged between samples (n = 4, FA and DE). Error bars are shown as standard deviation between n, which are biological replicates. b Genomic location of DMRs. The genomic locations of the identified DMRs were labeled as promoter (< 3000 kb upstream of TSS), intronic, exonic, or intergenic, and plotted in a pie chart showing the percentage of DMRs for a given designation

