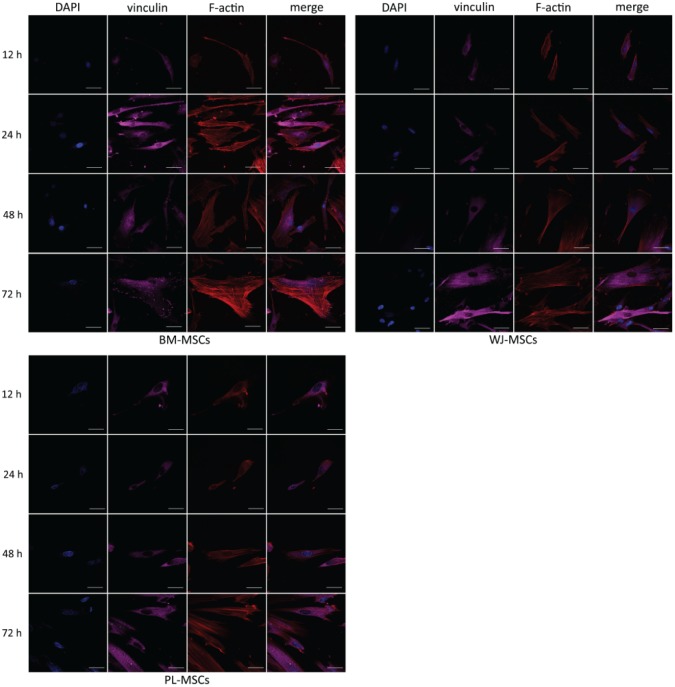
Figure 3.
Temporal course of vinculin and actin distribution in MSCs cultured on 2D. Cells were cultured on glass coverslips for 12 h, 1, 2, and 3 days, fixed and stained for nuclei (blue), F-actin (red), and vinculin (magenta). In each case, vinculin detection in FAs was augmented in a time-dependent manner. Representative confocal micrographs are shown. PL-MSCs: placenta mesenchymal stem cells; BM-MSCs: bone marrow mesenchymal stem cells; WJ-MSCs: Wharton’s jelly mesenchymal stem cells. Bars represent 50 μm.

