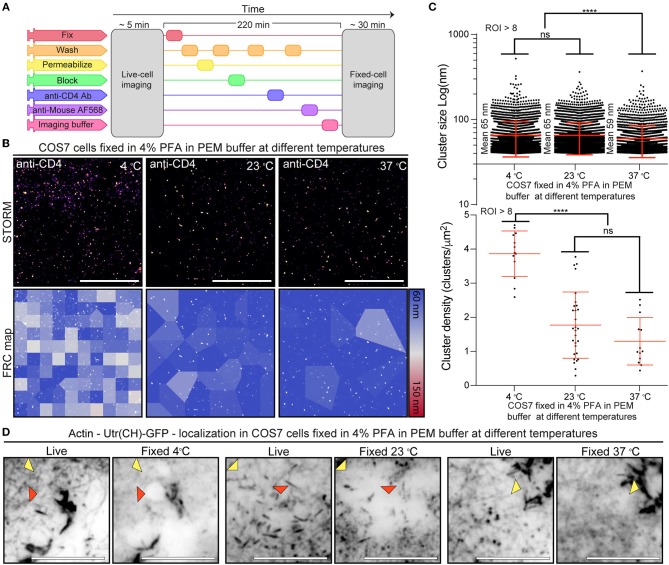
Figure 3.
Correlation between CD4 membrane organization and actin structure fidelity upon fixation (A) NanoJ-Fluidics protocol to perform live-to-fixed cell correlation under different fixation conditions. (B) CD4 STORM imaging after fixation in different conditions (Top) and FRC map of the same region (Bottom). Scale bars are 5 μm. (C) CD4 cluster size and cluster density under different fixation conditions. (D) Diffraction limited (TIRF) live-to-fixed cell correlation using different fixation conditions. Red arrowheads highlight areas where actin disappeared upon fixation. Yellow arrowheads highlight areas where there is a difference in actin organization due to fixation. Scale bars are 1 μm. ****p < 0.001.

