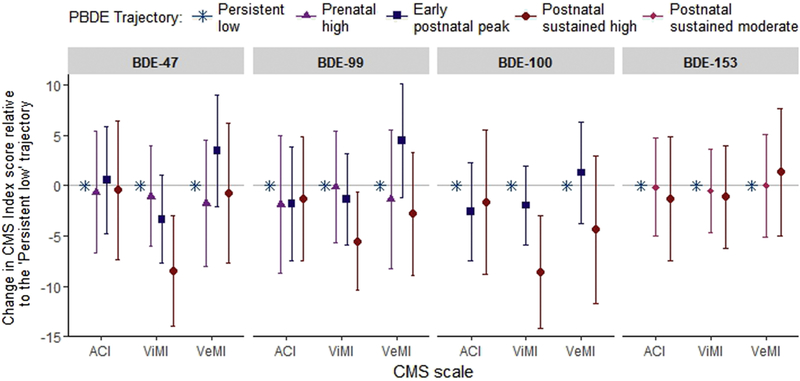
Figure 4. Point estimates (ß) and 95% CIs from adjusted models examining trajectories of plasma PBDE concentrations in relation to Attention Concentration Index (ACI), Visual Memory Index (ViMI), and Verbal Memory Index (VeMI) scores (n=212).
See Supplemental Material, Figure S2, which plots PBDE trajectories.

