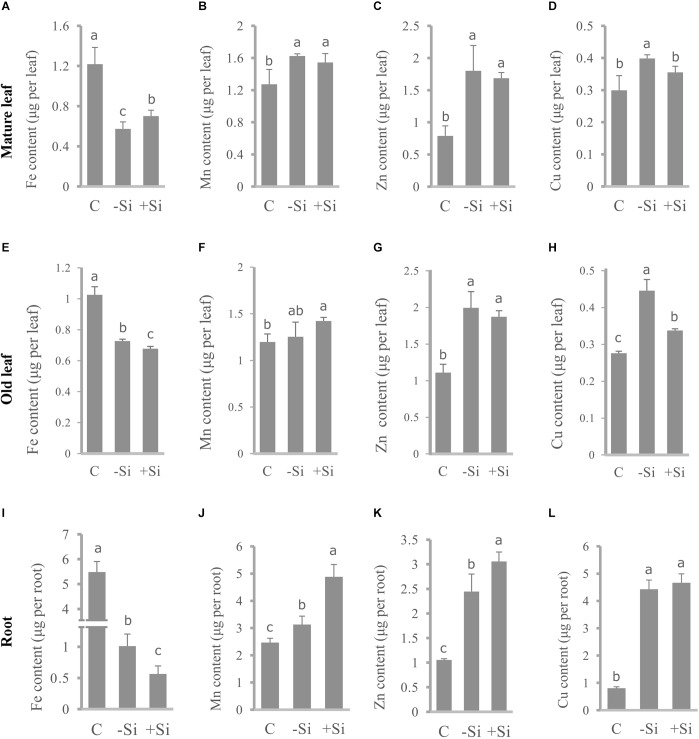
FIGURE 4.
Effect of Si nutrition on micronutrient content in different organs of barley, 3 weeks after Fe withdrawal. Mature leaf (second leaf, L2): (A–D). Old leaf (first leaf, L1): (E–H). Root: (I–L). Content of Fe: (A,E,I). Content of Mn: (B,F,J). Content of Zn: (C,G,K). Content of Cu: (D,H,L). The plants were treated as described in the legend of Figure 1 (C- control plants grown optimally supplied with Fe; -Si – plants grown in the absence of Fe and Si; +Si – plants grown in the absence of Fe and supplied with Si). Data shown are means ± s.d. (n = 3). Significant differences (P < 0.05) between treatments are indicated by different letters.

