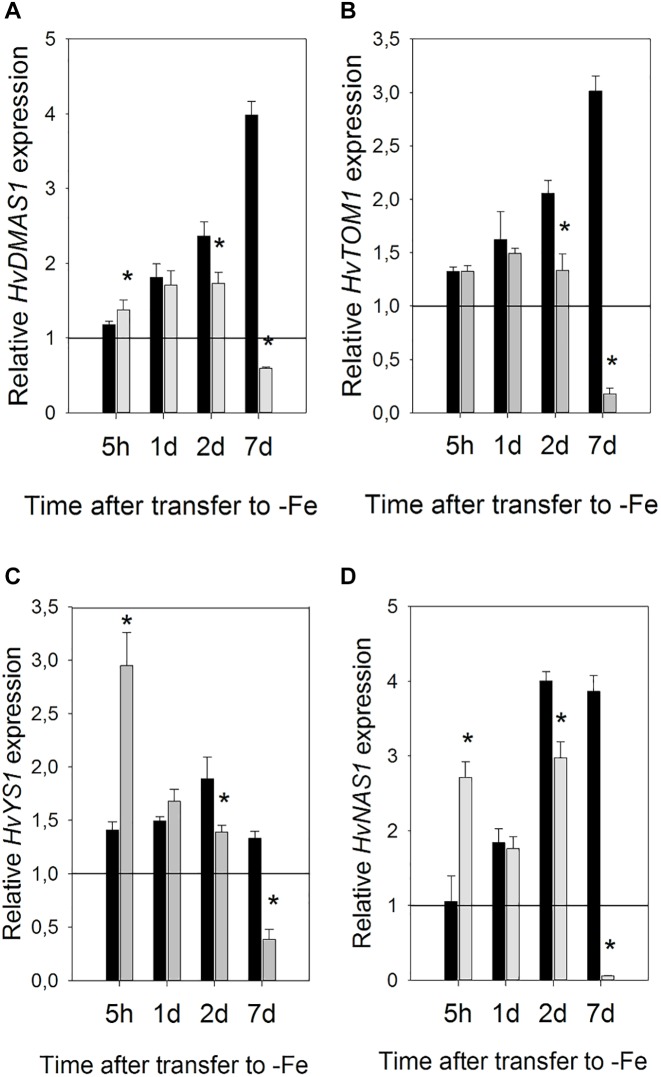
FIGURE 6.
Effect of Si supply on the relative expression level of (A) HvDMAS, (B) HvTOM, (C) HvYS1 and (D) HvNAS1 in barley roots 5 h and 1, 2, and 7 days after iron withdrawal from the nutrient solution. The plants were treated as described in the legend of Figure 1 (-Si – plants grown in the absence of Fe and Si; +Si – plants grown in the absence of Fe and supplied with Si). Gene expression is normalized to the values obtained for control plants grown in optimal Fe supply, which was set to 1.0. Black bars -Si; gray bars +Si. Data shown are means ± s.d. (n = 3). Significant differences (P < 0.05) between -Si and +Si treatments for each time point are indicated by asterisks.

