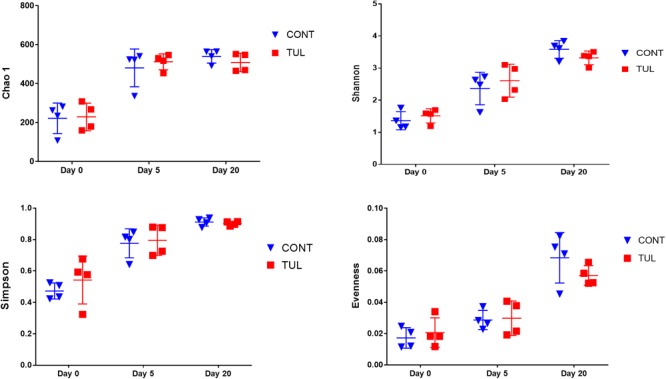
FIGURE 4.

The difference in bacterial diversity indices (Chao 1, Shannon, Simpson and Evenness) measures between the control (CONT) and tulathromycin (TUL) groups at different sampling days (0, 5, and 20). The individual data points, which represent bacterial diversity for each piglet, are depicted. Error bars represent the standard errors.
