. 2019 Feb 21;10(14):4038–4047. doi: 10.1039/c8sc04935a

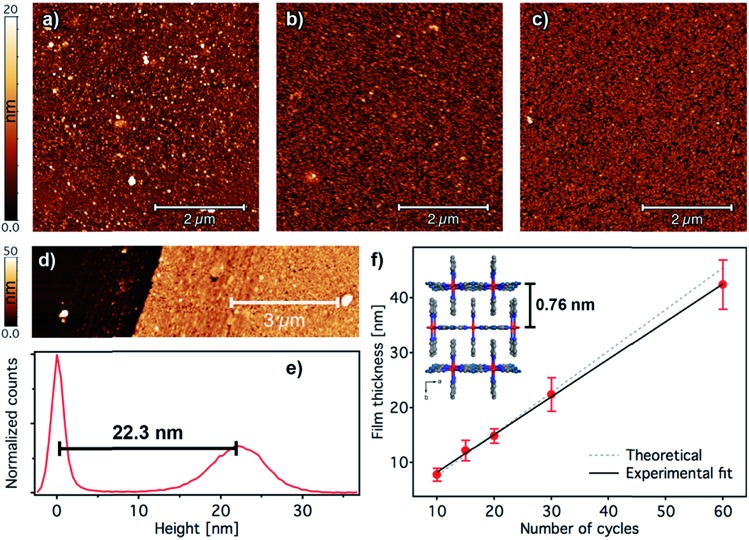
Fig. 5. Surface morphology and thickness analysis of [Fe(py)2{Pt(CN)4}] ultrathin films. 5 × 5 μm2 AFM topography images of 2 (a), 5 (b), and 10 (c) cycle samples. (d) Example of an AFM topographic image of a manually scratched 30-cycle film and its corresponding height distribution (e) showing a thickness of 22.3 nm. (f) Evolution of the film thickness with the number of cycles. Height distributions were extracted from AFM images of manually scratched samples. Experimental thickness values were calculated by averaging at least three images of at least two samples; error bars correspond to standard deviations. A fit of the film thickness data versus the number of cycles (black line) yields an average thickness of 0.72 ± 0.03 nm per immersion cycle. This experimental value is in excellent agreement with the theoretical value of 0.76 nm increase per layer of [Fe(py)2{Pt(CN)4}] (dashed grey line) as extracted from the reported crystal structure in the HS.46.

Fig. 5