. 2019 Feb 21;10(14):4038–4047. doi: 10.1039/c8sc04935a

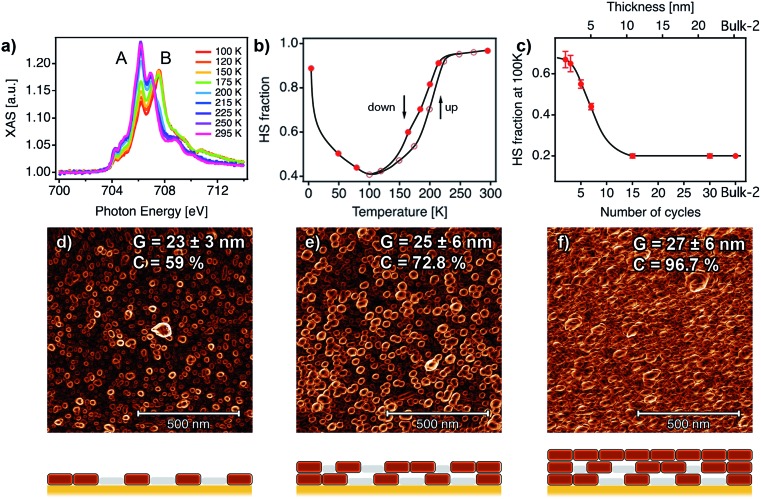
Fig. 6. SCO behaviour in ultrathin films analysed with XAS data and correlation with the film microstructure. (a) XAS spectra as a function of temperature for a 7-cycle [Fe(py)2{Pt(CN)4}] thin film. (b) HS fraction as a function of the temperature for the 7-cycle film. (c) HS fraction at 100 K as a function of the number of cycles (1 cycle ≈ 0.72 nm). Black lines are a guide to the eye. 1 × 1 μm2 AFM topography images of 2 (d), 5 (e) and 10 (f) cycles after being processed with a Prewitt operator to highlight particle edges.61,62 The changes in the microstructure of the films with the number of cycles were monitored by analysing the mean lateral grain size (G) and film coalescence (C) in 1 × 1 μm2 AFM images (see Fig. S15, S16 and Table S2). Schematic illustrations of the microstructure of each film are shown below each AFM image, showing the evolution from a film composed of isolated nanocrystals to a fully coalesced one.

Fig. 6