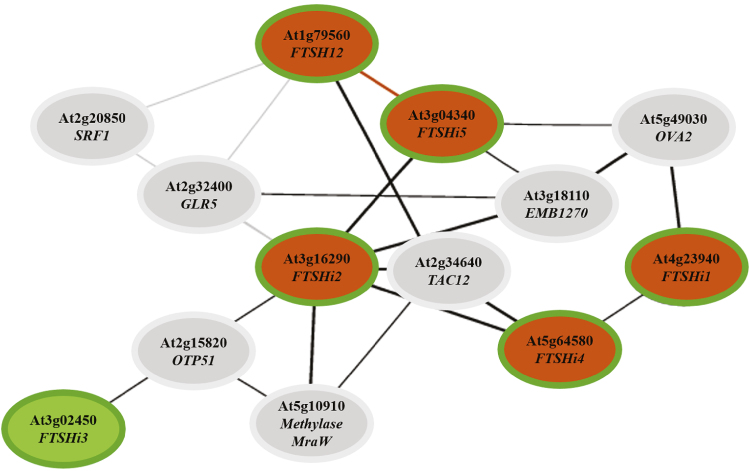
Fig. 2.
Co-expression network of the five FTSHi genes (green borders) in Arabidopsis. Co-expressed genes are connected by lines as follows: bold lines, mutual rank (MR) <5; black lines, MR<30; thin grey lines, MR≥30; orange lines, predicted protein–protein interaction. Orange shading indicates an identified protein–protein interaction (Kikuchi et al., 2018; Schreier et al., 2018). The co-expressed genes and their corresponding protein names and localizations predicted by TargetP and WoLF PSORT as identified in ATTED-II are listed in Supplementary Table S4.

