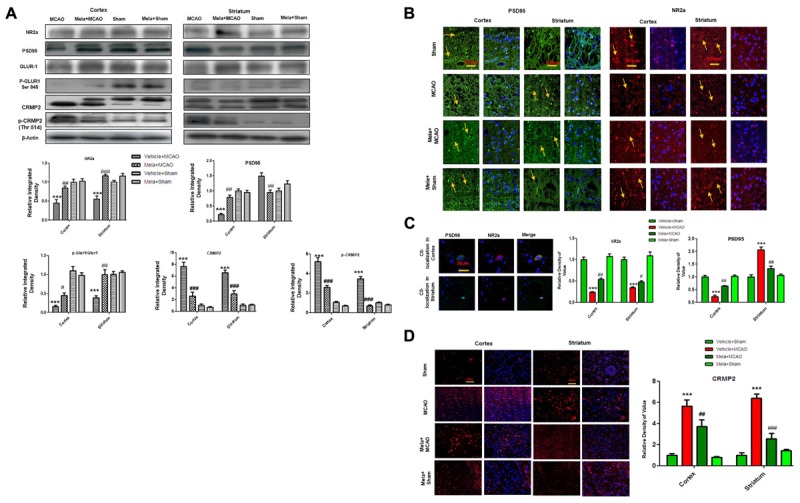
FIGURE 2.

Effect of melatonin on glutamate (Glu) receptor subunits. (A) Western blot analysis of NR2a, PSD95, GluR1, p-GluR1 (Serine 845), CRMP2, p-CRMP2 (Thr 514) from sham-operated control group, vehicle-treated MCAO, melatonin-treated MCAO animals and melatonin treated sham group (n = 7 rats per group). The bands were quantified using ImageJ, analyzed by graph-pad prism-5 software. β-actin was used as control. Densitometric analysis was expressed in arbitrary units as the mean ± SEM for the indicated proteins. (B) Immunofluorescence reactivity of PSD95 and NR2a; (n = 7 rats/group). The above data is representation of 3 numbers of experiments. Scale bar = 100 μm and magnification 40×. PSD95 and NR2a show cytoplasmic localization and was visualized by FITC and TRITC. (C) Double immunofluorescence of NR2a and PSD95 in ischemic brain. PSD95 was visualized by FITC and NR2a by TRITC. Scale bar = 20 μm and magnification 40×. (D) Immunofluorescence reactivity of CRMP2; (n = 7 rats/group). The above data is representation of 3 numbers of experiments. Scale bar = 50 μm. CRMP2 was visualized by Alexa-Flour 594. Symbols # represent significant difference values p < 0.05, while symbol ## represent p < 0.01 values for significant differences, symbol ∗∗∗ and ### shows p < 0.001. Symbols ∗ shows significant difference relative to sham control while # shows significant difference relative to MCAO.
