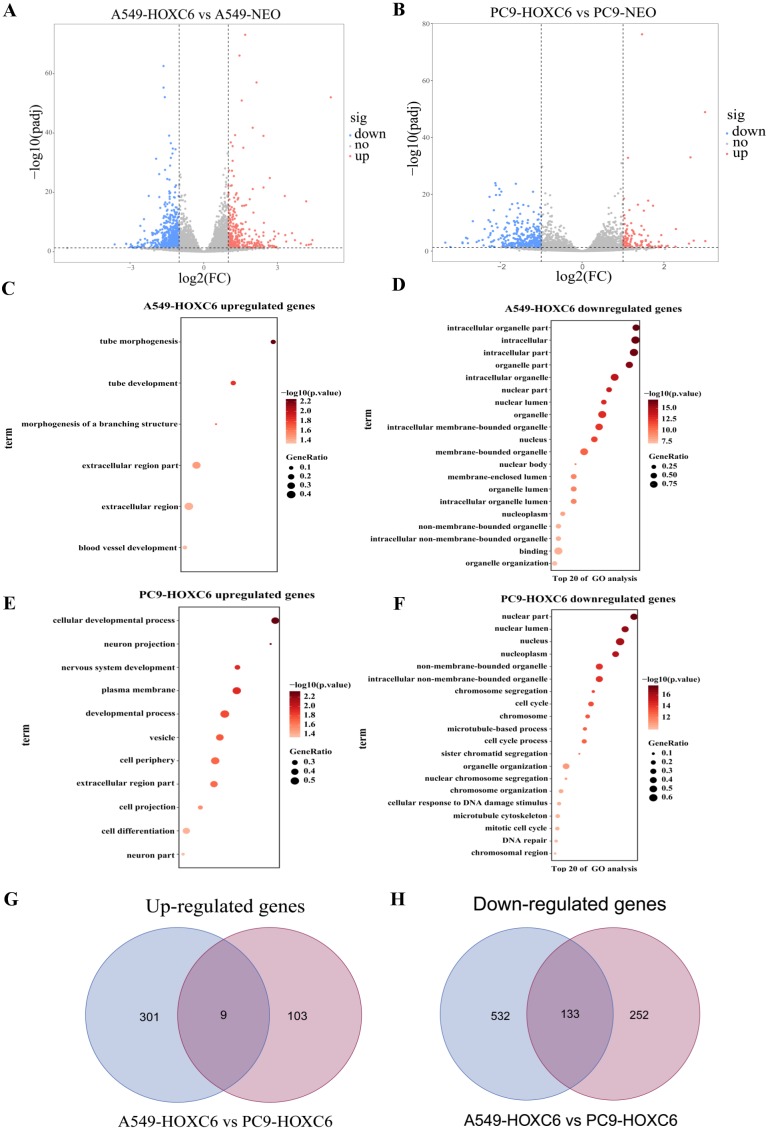
Figure 4. Analysis of RNA-seq.
(A) The volcano map shows 310 upregulated genes and 665 downregulated genes in A549-HOXC6 cells in comparison to A549-NEO cells, and 112 upregulated genes and 385 downregulated genes in PC9-HOXC6 cells in comparison to PC9-NEO cells. Log2 fold change (Log2FC) >1 or <−1, and P < 0.05 were considered to be statistically significant. (B) Gene ontology (GO) analysis identified biological processes impacted by HOXC6-regulated genes in NSCLC cells. (C) Overlap of upregulated and downregulated genes in A549-HOXC6 and PC9-HOXC6 cells.

