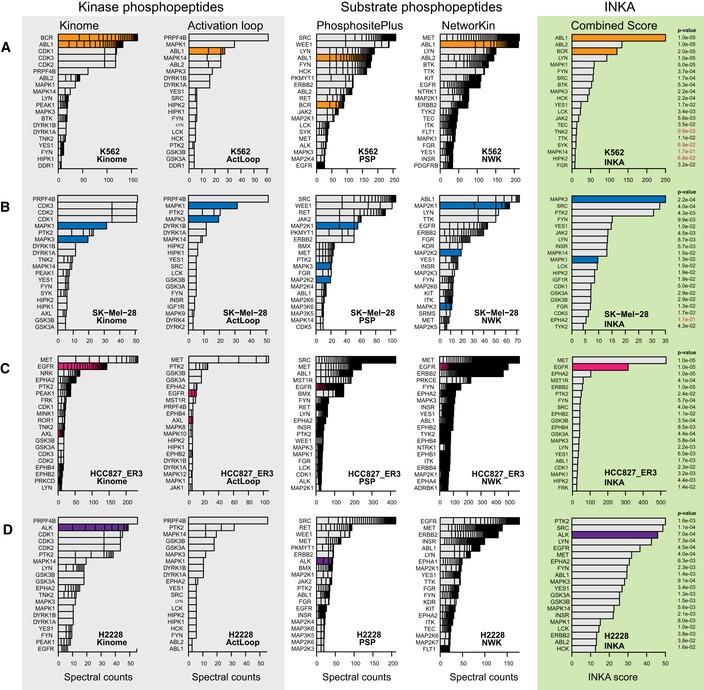
K562 chronic myelogenous leukemia cells with a BCR‐ABL fusion. INKA score ranking indicates that ABL1/BCR‐ABL (orange bars) exhibits principal kinase activity in this cell line, in line with a role as an oncogenic driver.
SK‐Mel‐28 melanoma cells with mutant BRAF. In the “kinome” analysis, CDK1, CDK2, and CDK3 share a second place, based on phosphopeptides that cannot be unequivocally assigned to either of them. INKA scoring implicates MAPK3 as the number one activated kinase. As SK‐Mel‐28 is driven by BRAF, a serine/threonine kinase that is missed by pTyr‐based phosphoproteomics, downstream targets in the MEK‐ERK pathway are highlighted by blue coloring.
Erlotinib‐resistant HCC827‐ER3 NSCLC cells with mutant EGFR. INKA scores reveal the driver EGFR (pink coloring) as second‐highest ranking and MET as highest ranking kinase, respectively.
H2228 NSCLC cells with an EML4‐ALK fusion. The driver ALK (purple coloring) is ranked as a top 3 kinase by INKA score, slightly below PTK2 and SRC.
Data information: For each cell line, bar graphs depict kinase ranking based on kinase‐centric analyses (panel “Kinase phosphopeptides”), substrate‐centric analyses (panel “Substrate phosphopeptides”), and combined scores (panel “INKA”). Bar segments represent the number and contribution of individual phosphopeptides (kinase‐centric analyses) or phosphosites (substrate‐centric analyses). Since substrate‐centric inference attributes data from multiple, possibly numerous, substrate phosphosites to a single kinase, bar segments coalesce into a black stack in more extreme cases.
P‐values flanking INKA score bars were derived through a randomization procedure with 10
5 permutations of both peptide‐spectral count links and kinase–substrate links.
P‐values in red are above a significance threshold of
P < 0.05.

