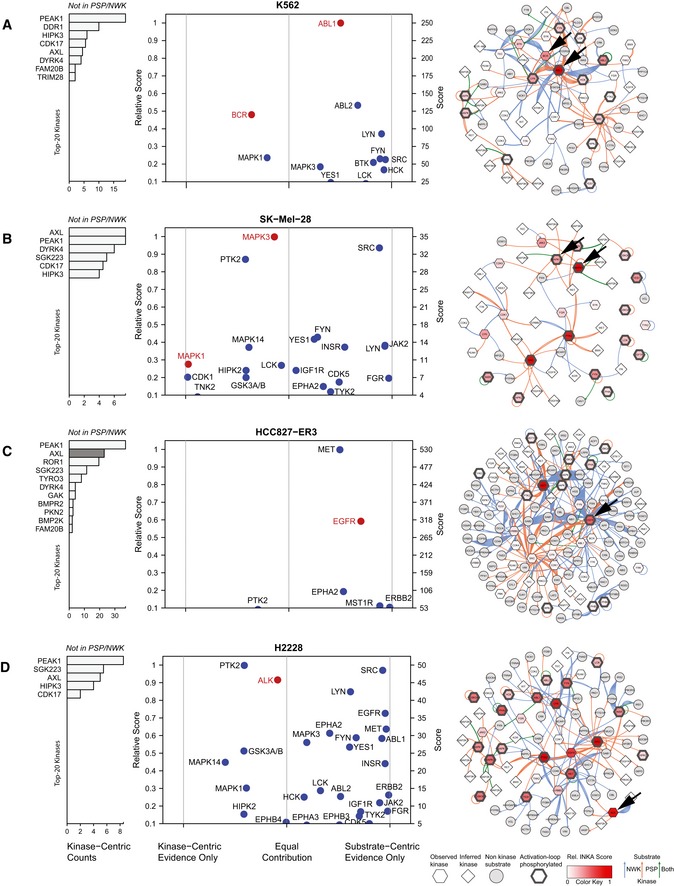
Figure 3. INKA plots and kinase–substrate relation networks for four oncogene‐driven cell lines.

- K562 CML cells with a BCR‐ABL fusion. ABL1 is the most activated kinase, with relatively equal contributions from both analysis arms. It is a highly connected, central node in the network.
- SK‐Mel‐28 melanoma cells with mutant BRAF. Downstream MEK‐ERK pathway members are highlighted in lieu of BRAF which is missed by the current pTyr‐based workflow. MAPK3 is the top activated kinase. The network includes two clusters with highly connected activated kinases, MAPK1/3 and SRC, respectively.
- Erlotinib‐resistant HCC827‐ER3 NSCLC cells with mutant EGFR. EGFR and MET are the most active, highly connected kinases. AXL, inactive in parental cells (see Appendix Fig S8), but associated with erlotinib resistance in this subline, can only be analyzed through the kinase‐centric arm (pink bar highlighting).
- H2228 NSCLC cells with an EML4‐ALK fusion. ALK is a high‐ranking kinase with roughly equal evidence from both analysis arms. Multiple highly active and connected nodes imply relative insensitivity to ALK inhibition, in line with previous functional data. Larger networks are shown in Appendix Figs S2–S5.
