
Figure 7. INKA‐guided selection of kinase drug targets in patient‐derived xenograft (PDX) tissue analyzed by pTyr‐based phosphoproteomics.
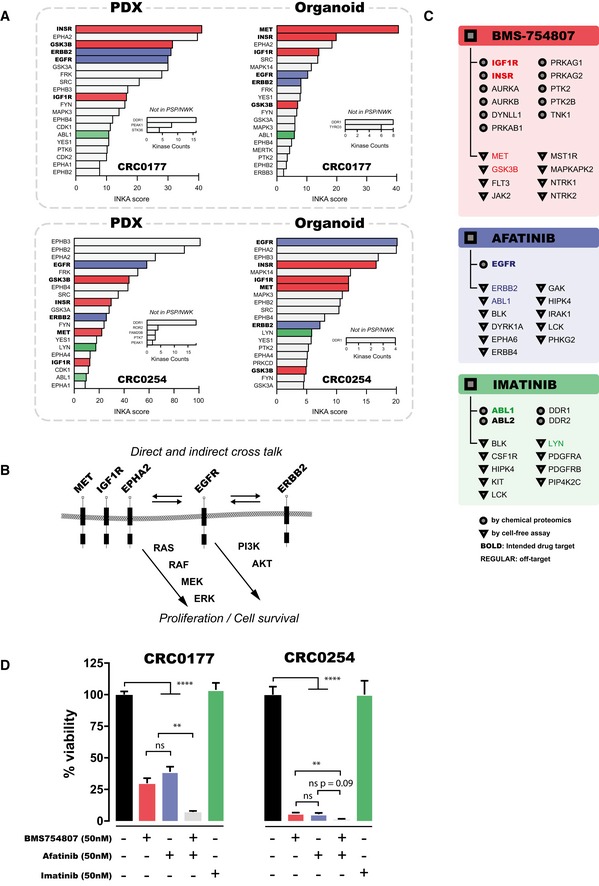
- INKA score ranking of the top 20 active phosphokinases in two PDX models (metastatic colorectal cancer, CRC0177 and CRC0254) indicates high activity of receptor tyrosine kinases IGF1R/INSR, EGFR, ERBB2, EPHA1/2, EPHB1‐4, and MET. Bar colors indicate targets of tyrosine kinase inhibitors BMS‐754807 (red), afatinib (blue), and imatinib (green). The arrow indicates MET, a receptor tyrosine kinase that is in the INKA top 20 for CRC0254, but not CRC0177.
- Scheme indicating signal transduction pathways of IGF1R/INSR, EGFR, ERBB2, EPHA2, and MET. These receptors reciprocally activate each other due to physical association and receptor trans‐phosphorylation, and induce downstream activation of MAPK and PI3K/AKT signaling with subsequent stimulation of cellular proliferation and survival.
- Overview of experimentally established targets of BMS‐754807 (coral‐colored panel), afatinib (blue panel), and imatinib (green panel) with an affinity in the nanomolar range. Targets denoted by circles were discovered using a chemical proteomics approach (Klaeger et al, 2017), and those denoted by triangles were identified using cell‐free assays (Carboni et al, 2009; Mulvihill et al, 2009; Davis et al, 2011). Kinases in bold type are intended drug targets while kinases that are off‐targets are given in plain type. Kinases with a top 20 INKA score for models CRC0177 or CRC0254 are indicated by matching colors as in panel A (coral: BMS‐754807, blue: afatinib, green: imatinib).
- Viability of PDX‐derived organoids in response to target inhibition. Organoids were incubated without drugs (black bars), 50 nM INSR/IGF1R inhibitor BMS‐754807 (coral‐colored bars), 50 nM EGFR inhibitor afatinib (blue bars), both drugs (gray bars), or 50 nM ABL inhibitor imatinib (green). Treatment with individual drugs resulted in a significant reduction of organoid viability, with the combination of both inhibitors leading to almost complete abrogation of cell viability in CRC0254. The increased sensitivity of CRC0254 relative to CRC0177 may be explained by BMS‐754807‐mediated inhibition of MET, which was inferred to have a high activity in CRC0254 but less so in CRC0177 (see panel A). Imatinib, which targets ABL, a kinase ranking low by INKA for the CRC PDX models and organoids, was used as negative control and indeed showed negligible inhibition. Statistical analysis was performed using ordinary one‐way ANOVA. Error bars represent SEM. Asterisks represent the level of significance (**P < 0.01; ****P < 0.0001). Numbers of replicates analyzed are: for control, 47 (CRC0177) and 17 (CRC0254); for BMS‐754807: 16 and 12; for afatinib: 13 and 3; for afatinib+BMS‐754807: 6 and 3; for imatinib: 6 and 6.