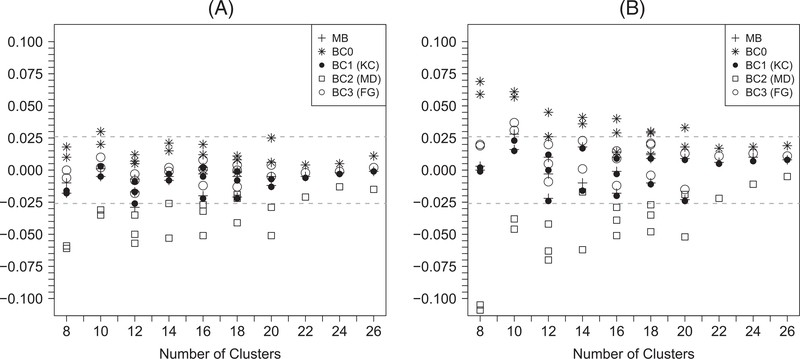
FIGURE 3.
Differences between the empirical power and the predicted power of generalized estimating equation–based (A) z-tests and (B) t-tests for continuous outcomes. MB: model-based variance; BC0: uncorrected sandwich variance; BC1: Kauermann-Carroll sandwich variance; BC2: Mancl-DeRouen sandwich variance; BC3: Fay-Graubard sandwich variance. The acceptable bounds are shown with the dashed horizontal lines. For each value of n, there may be multiple points with the same symbol indicating results with different values of m and α0 and α1

