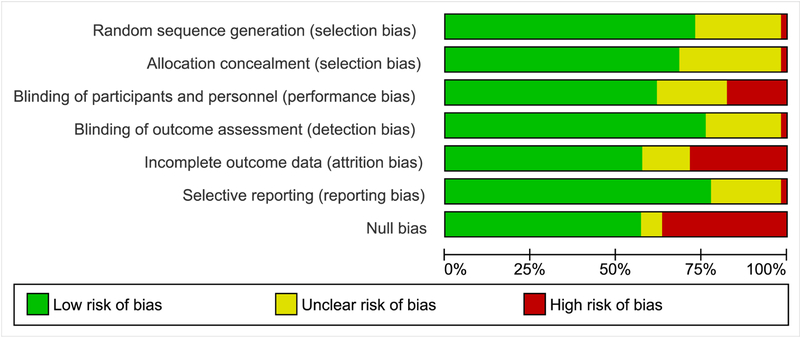
Figure 2. Risk of bias graph.
Figure 3 summarizes the risk of bias graphically across all included studies based on the review authors’ judgements about selection, performance, detection and attrition bias, as well as selective reporting and Null bias. A comprehensive risk of bias tables, published in our Cochrane Review, provides detail at the study level and support for the judgement in tabular form[29].

