
5.
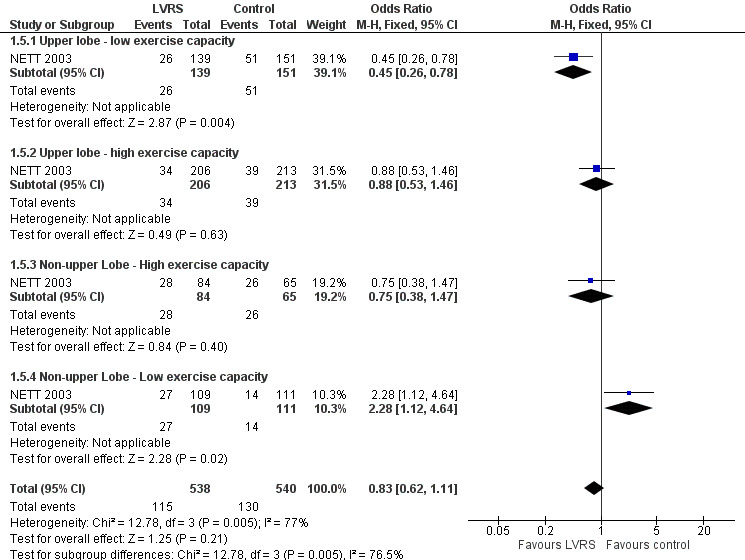
Forest plot of comparison: 1 Surgery versus control, outcome: 1.5 Overall mortality (stratified by subgroup, to end of follow‐up).
Official websites use .gov
A
.gov website belongs to an official
government organization in the United States.
Secure .gov websites use HTTPS
A lock (
) or https:// means you've safely
connected to the .gov website. Share sensitive
information only on official, secure websites.
Forest plot of comparison: 1 Surgery versus control, outcome: 1.5 Overall mortality (stratified by subgroup, to end of follow‐up).