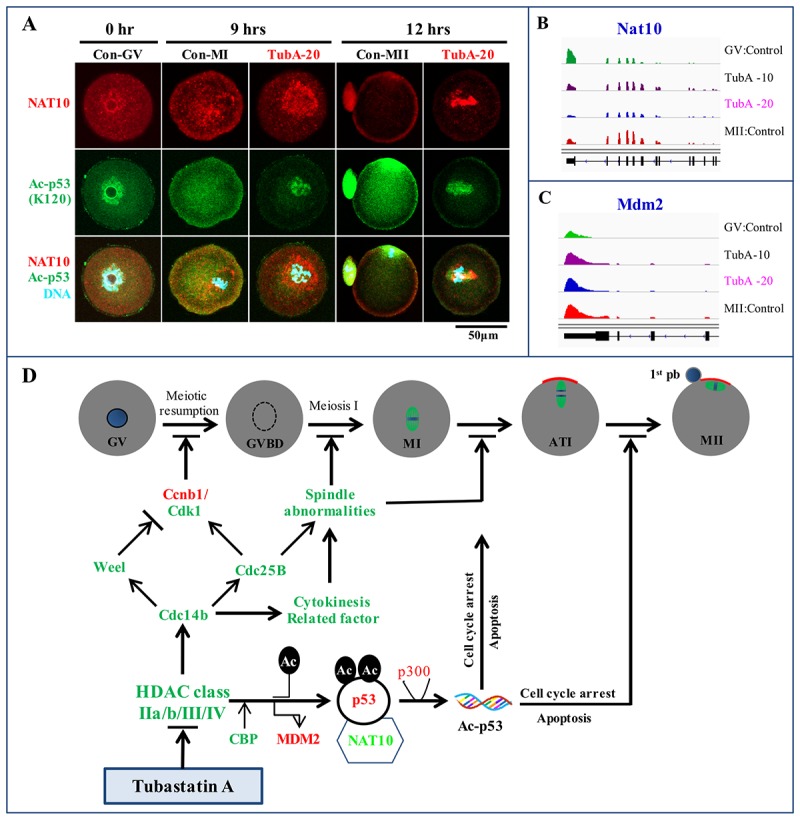
Figure 6.

Immunofluorescence analysis and a putative TubA mechanism in mouse oocytes. (A) Confocal immunofluorescence analysis of NAT10 and Ac-p53 expression at K120. The experiment was repeated three times. (B, C) Visualization of Nat10 and Mdm2 mRNA expression profiles using the IGV. (D) An underlying mechanism to explain TubA roles during oocyte maturation in the mouse. Green or red colors indicate mRNAs and proteins expression down- or up-regulated by TubA treatment, respectively.
